Dear Shareowners,
Building on the momentum we created leading up to the pandemic, P&G people delivered strong results across the top line, bottom line and cash again in fiscal year 2021. These results and our momentum reflect the underlying strength of our integrated strategy and our organization.
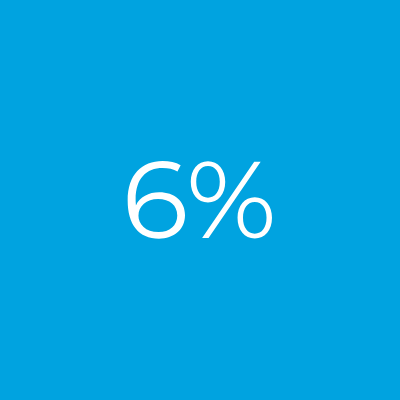
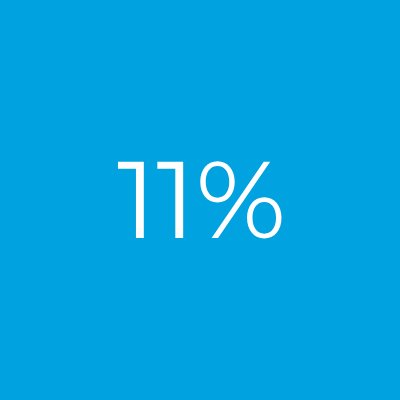
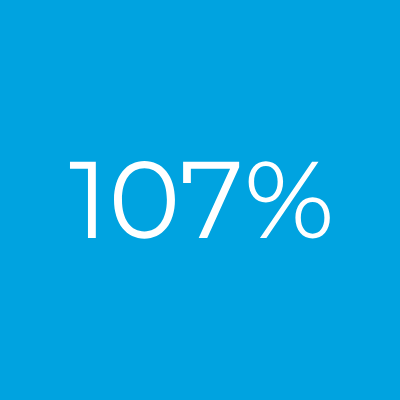
For the fiscal year, organic sales grew more than 6%, core earnings per share were up 11%, currency neutral core earnings per share were also up 11%, and adjusted free cash flow productivity was 107%. These are strong results in challenging circumstances on top of equally strong results leading up to the pandemic.
For perspective, in the six quarters preceding COVID-19, through the October to December 2019 quarter, we grew organic sales an average of 5%, ahead of market growth. This momentum has continued in 2020 and 2021, with organic sales growing an average of 6% over the past six quarters, while overcoming significant challenges as a result of the pandemic.
Our core earnings per share results tell a similar story, with calendar year 2019 quarterly core earnings per share growth 15% on average. That strength continued over the past six quarters, with core earnings per share growth of 9% on average.
In fiscal year 2021, growth was broad-based, with each of our 10 product categories growing or holding organic sales. Home Care grew in the high teens. Oral Care grew double digits. Skin & Personal Care grew high single digits. Grooming, Fabric Care, Feminine Care, Hair Care and Personal Health Care each grew mid-single digits. Family Care grew low single digits, and Baby Care sales were in line with the prior fiscal year.
We again delivered strong results in our two largest and most profitable markets. Organic sales were up 8% in the U.S. and 12% in Greater China for the fiscal year.
Focus markets grew 7% for the year. Enterprise markets grew 5% despite significant market growth impacts from the pandemic.
E-commerce sales were up 35% for the year and are now over $10 billion in sales, representing 14% of total Company sales.
P&G’s global aggregate market share increased 50 basis points, and 33 of our top 50 country/category combinations held or grew share for the year.
Our quarterly dividend increase of 10% in April 2021
was the largest increase in over a decade.
We returned $19 billion of value to shareowners through $8 billion in dividends and $11 billion in share repurchase. In April, we announced a 10% increase in our dividend — the 65th consecutive annual dividend increase, and the 131st consecutive year in which P&G has paid a dividend.
To sum up, P&G people have operated with excellent discipline in a challenging and volatile environment, and we exceeded each of our going-in targets for the year, across organic sales growth, core EPS growth, free cash flow productivity and cash returned to shareowners.
While we’re pleased with these results and the overall strength of our business, the external environment continues to be volatile and difficult to predict, and our eyes are wide open to the many challenges we face. We compete in product categories against highly capable multinational and local competitors. Raw material and transport freight costs have risen sharply. Increased social unrest and economic distress in many parts of the world are putting pressure on local GDP growth. Geopolitical divisions are creating business uncertainty. And the pandemic continues to create risks of supply chain disruptions.
Indeed, the biggest uncertainty we face remains the pandemic, and many countries are still experiencing high numbers of COVID-19 cases. Virus spikes in some markets will likely delay their economic recovery, and current models predict it may be 2023 or 2024 before there are enough vaccines broadly distributed to cover the world’s population.
While the near term will be challenging, we’re stepping forward, not back — focused on our integrated strategy and our immediate priorities to grow through the difficulties we’re facing.
Please see Measures Not Defined by U.S. GAAP in the [Downloads section](/annualreport2021/annual-report-downloads/), or page 73 of the print Annual Report, for definitions of non-GAAP measures and reconciliations to the most closely related GAAP measure.
VARIOUS STATEMENTS IN THIS ANNUAL REPORT, including estimates, projections, objectives and expected results, are “forward-looking statements” within the meaning of the Private Securities Litigation Reform Act of 1995, Section 27A of the Securities Act of 1933 and Section 21E of the Securities Exchange Act of 1934 and are generally identified by the words “believe,” “expect,” “anticipate,” “intend,” “opportunity,” “plan,” “project,” “will,” “should,” “could,” “would,” “likely” and similar expressions. Forward-looking statements are based on current assumptions that are subject to risks and uncertainties that may cause actual results to differ materially from the forward-looking statements, including the risks and uncertainties discussed in Item 1A – Risk Factors of the Form 10-K included in this Annual Report. Such forward-looking statements speak only as of the date they are made, and we undertake no obligation to update or revise publicly any forward-looking statements, except as required by law.


